Recently I stumbled upon a small problem with using labels in horizontal axes in TChart
when adding different numbers of values in several series.
Namely, TChart takes labels for values in an axis from the labels of the first series.
So, if in the first series you have less values than in other series,
labels won't show up in an axis:
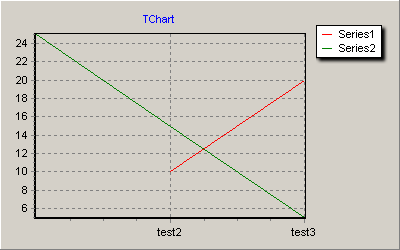
The code for the above example is as follows (now value in the first series for X = 10):
  Series1.AddXY(20, 10, 'test2');
  Series1.AddXY(30, 20, 'test3');

  Series2.AddXY(10, 25, 'test1');
  Series2.AddXY(20, 15, 'test2');
  Series2.AddXY(30,  5, 'test3');
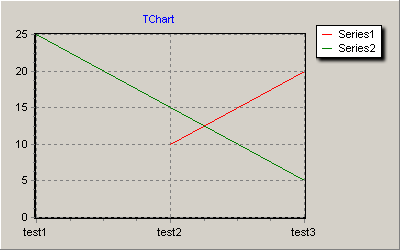
To fix this issue, add a NULL value to the first series for all X values
that need to have a label in an axis:
Series1.AddNullXY(10, 0, 'test1');
The second value (Y) is not relevant here.
Now, the label for X = 10 is displayed in the bottom axis:
This works nicely in D2007, but that's not enough in D2009.
In the new version of Delphi you have to set the series' TreatNulls to Dont Paint.
What's more, you have to set this in the designer:
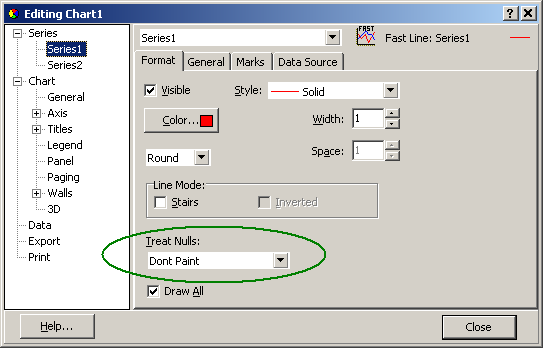
The following code, when added to the code snippets above, will not do (IME):
Series1.TreatNulls := tnDontPaint;
HTH
Top
|